This post is part of a series – click ‘previous’ or ‘next’ at the bottom of this page for more.
Who has the better metrics? Player A or player B?
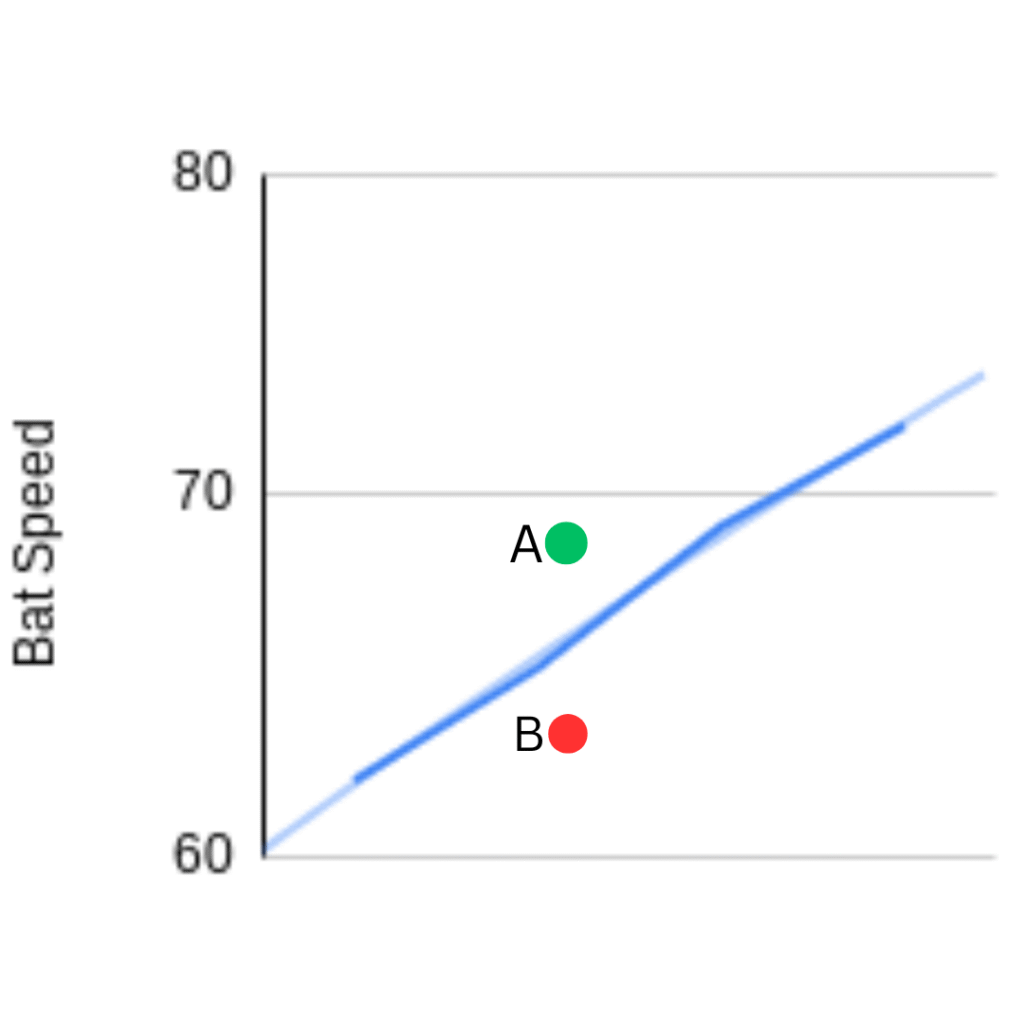
Player A: 68 mph
Player B: 63 mph
It’s a trick question.
This chart only represents ABSOLUTE bat speed [compared to true D1 AVG].
We don’t have enough information yet.
Relative Bat Speed [relative to HS year]
Suppose player A is a HS senior…
…while player B is a sophomore.
Player A: 68 mph
Player B: 63 mph
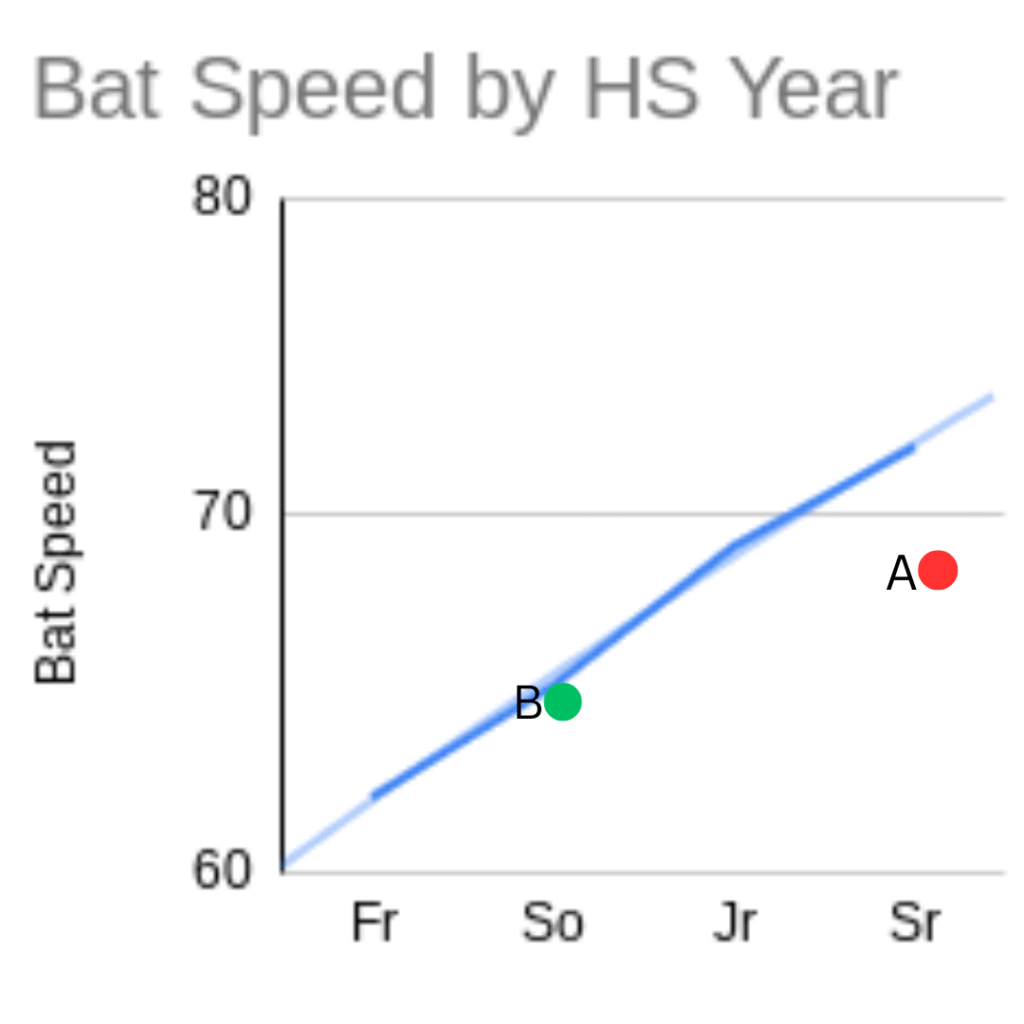
Who has the better metrics now?
Player B still has less ABSOLUTE bat speed
…but is closer to being on the D1 trend-line.
We still need more context…
…but we’re getting a clearer picture.
Relative Bat Speed [relative to player size/physical development]
<< D1 Hitting Metrics Calculator >>
…Suppose HS senior player A is 5’9 200 lbs…
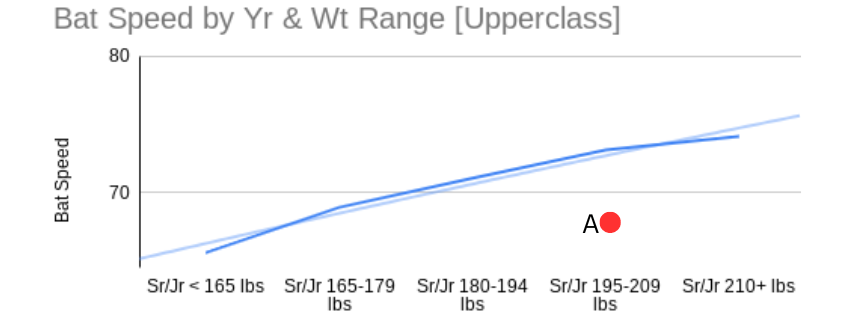
While HS sophomore player B is 5’10 145 lbs.
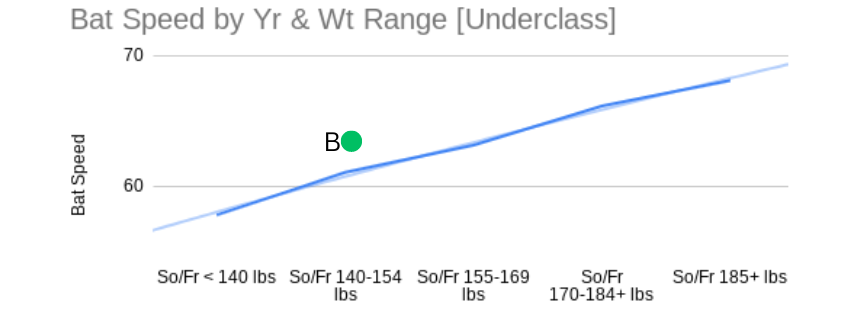
Who has the better metrics now?
Player B is now above the D1 trend-line with year & size context. Player A has fallen below.
Bottom line: Relative Metrics Matter More
Think in terms of the direction your metrics are trending and being in the appropriate range for your year & development.
To find out if your relative metrics are on track for D1 (relative to your age and level of physical development), check out our free hitting metrics calculator.